
The Biggest Problem Investors Face
Why the gap between investment returns and investor returns matters more than most people realize
Markets have historically delivered strong long-term returns. The average investor has not come close to capturing them.
This is not primarily a story about bad investments. It is a story about behavior. The funds most investors hold have performed reasonably well. The investors holding them have not, because they have bought and sold at the wrong times, reacted to headlines, and made decisions driven by emotion rather than plan.
The result is a persistent, well-documented gap between what investments earn and what investors actually realize. And it is more costly than most people assume.
The Gap Is Real, and It Has Been Measured
Multiple independent research organizations have studied this phenomenon over extended time periods, and their findings are consistent.
Morningstar's annual Mind the Gap study compares dollar-weighted investor returns (what investors actually earned, accounting for when money moved in and out) against the time-weighted returns of the funds themselves (what a buy-and-hold investor would have earned). In its most recent edition, covering the 10 years ended December 31, 2024, investors forfeited an estimated 1.2% per year through mistimed purchases and sales. That gap was present in every single calendar year of the study period.
Vanguard's Advisor's Alpha research reaches a similar conclusion from a different angle, estimating that behavioral coaching alone may contribute up to approximately 2.0% in annual net returns, under certain circumstances, though actual benefits vary by investor.
Russell Investments' Value of an Advisor study quantifies the gap by comparing the S&P 500's annualized return against the actual investor return for the Morningstar Large Blend category average over the 15 years ended December 31, 2024. The difference: 2.3% per year.
The range across these studies, 1.2% to 2.3% annually, reflects differences in methodology, time period, and what each study is measuring. But the direction of the finding is unanimous.
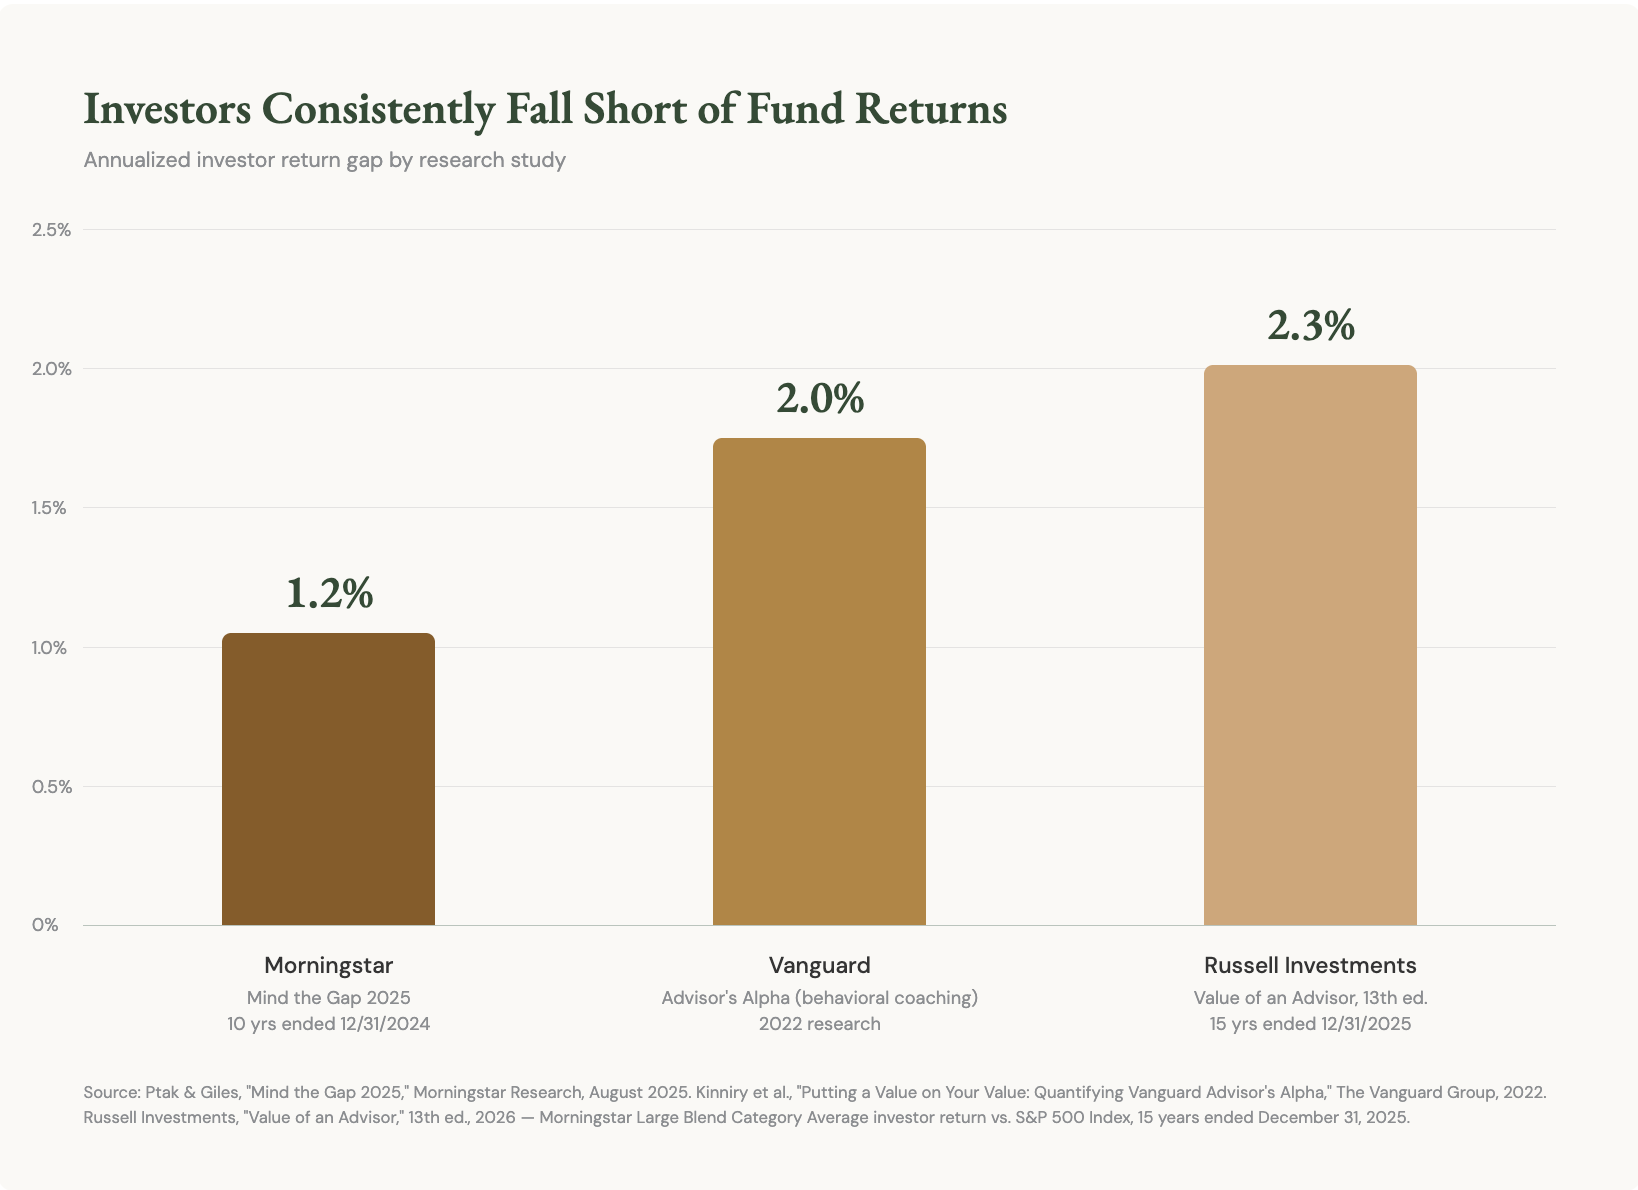
*Figures shown represent estimates from separate research studies using different methodologies and are presented to illustrate the range of findings rather than provide a direct comparison.
Why It Happens
The gap is not random. It follows a predictable pattern, and it tends to widen during exactly the moments when staying the course matters most.
When markets fall sharply, investors sell. When markets recover strongly, investors buy back in, often after much of the rebound has already occurred. The academic term for this is performance chasing. The practical effect is buying high and selling low, repeatedly, over a lifetime of investing.
Several well-studied behavioral tendencies drive this pattern. Loss aversion causes investors to feel the pain of a decline more acutely than the satisfaction of an equivalent gain, leading to panic at precisely the wrong moment. Recency bias causes investors to extrapolate recent market conditions indefinitely into the future, selling after a downturn as though the losses will never end. Overconfidence leads investors to trade more frequently than is warranted, with research consistently showing that the more active the investor, the wider the gap.
None of this is irrational in a human sense. It is a natural response to uncertainty. But the financial cost is real and compounds over time.
What Actually Helps
There is no strategy that eliminates the emotional difficulty of investing through market volatility. But there are factors that consistently correlate with narrowing the gap.
A written financial plan provides a reference point when markets become unsettling. When emotions push toward action, a documented strategy shifts the question from "what should I do right now?" to "does this decision align with the plan we built together?"
A consistent process for reviewing the portfolio, separate from day-to-day market movements, reduces the frequency of reactive decisions. Structure is protective.
And an objective voice, someone not caught up in the same emotional moment, who can provide perspective and context when it is hardest to find, is among the most practically valuable resources an investor can have. The research on behavioral coaching suggests this is not a soft benefit. It is a measurable one.
A Note on Where to Start
Understanding that behavior is the primary driver of investment underperformance is the first step. Building a plan designed to account for it, and having someone in your corner to help you stick to it when conditions are difficult, is the second.
If you would like to talk through how your current approach is positioned, we are happy to start that conversation.
Sources
Ptak, Jeffrey, and Margaret Giles. "Mind the Gap 2025." Morningstar Research. August 2025.
Kinniry, Francis M. et al. "Putting a Value on Your Value: Quantifying Vanguard Advisor's Alpha." The Vanguard Group. 2022.
Russell Investments, 'Value of an Advisor, 13th ed.,' 2026.
Disclosure
This article is provided by McAdam LLC ("McAdam" or the "Firm") for informational purposes only. Investing involves the risk of loss, and investors should be prepared to bear potential losses. Past performance is not indicative of future results and may have been impacted by events and economic conditions that will not prevail in the future. No portion of this article is to be construed as a solicitation to buy or sell any security or the provision of personalized investment, tax, or legal advice. Certain information contained herein is derived from sources believed to be reliable; however, McAdam does not guarantee the accuracy or completeness of such information and assumes no liability for any resulting damages.
Donohue Wealth Management is a DBA of McAdam LLC, an SEC-registered investment adviser. Registration does not imply a certain level of skill or training. Advisory services are offered through McAdam LLC.
Chart data sourced from Morningstar, Vanguard, and Russell Investments as cited above. For illustrative purposes only.