
The Retirement Risk You Probably Haven't Heard Of
Why the order of your returns, not just their average, can decide whether your money lasts a lifetime
Most people approaching retirement measure risk by market performance: will returns be strong enough to support the life they want? A more fundamental question is often overlooked: in what order will those returns arrive? That sequence has the potential to determine whether a portfolio lasts a lifetime.
What Is Sequence of Returns Risk?
Sequence of returns risk refers to the danger that the timing of negative returns, not just their magnitude, can determine whether a retirement portfolio survives.
During the accumulation phase, before withdrawals begin, sequence largely does not matter. A portfolio that loses 20% in year one and gains 20% in year ten will end up in roughly the same place as one that had those returns in reverse order. Time and compounding absorb the variation.
Retirement changes the equation entirely. Once withdrawals begin, every dollar taken out of the portfolio during a down market is a dollar that cannot recover when markets rebound. Selling shares at depressed prices to fund living expenses locks in losses that would otherwise be temporary. The portfolio shrinks not just from the loss itself, but from the withdrawal taken on top of it. Over time, the compounding effect works in reverse.
The Same Average Return, Three Different Retirements
Consider three hypothetical retirees. Each begins retirement with $1,000,000, withdraws $50,000 per year, and earns an average annual return of 6% over 30 years. The only difference is when strong and weak returns occur.
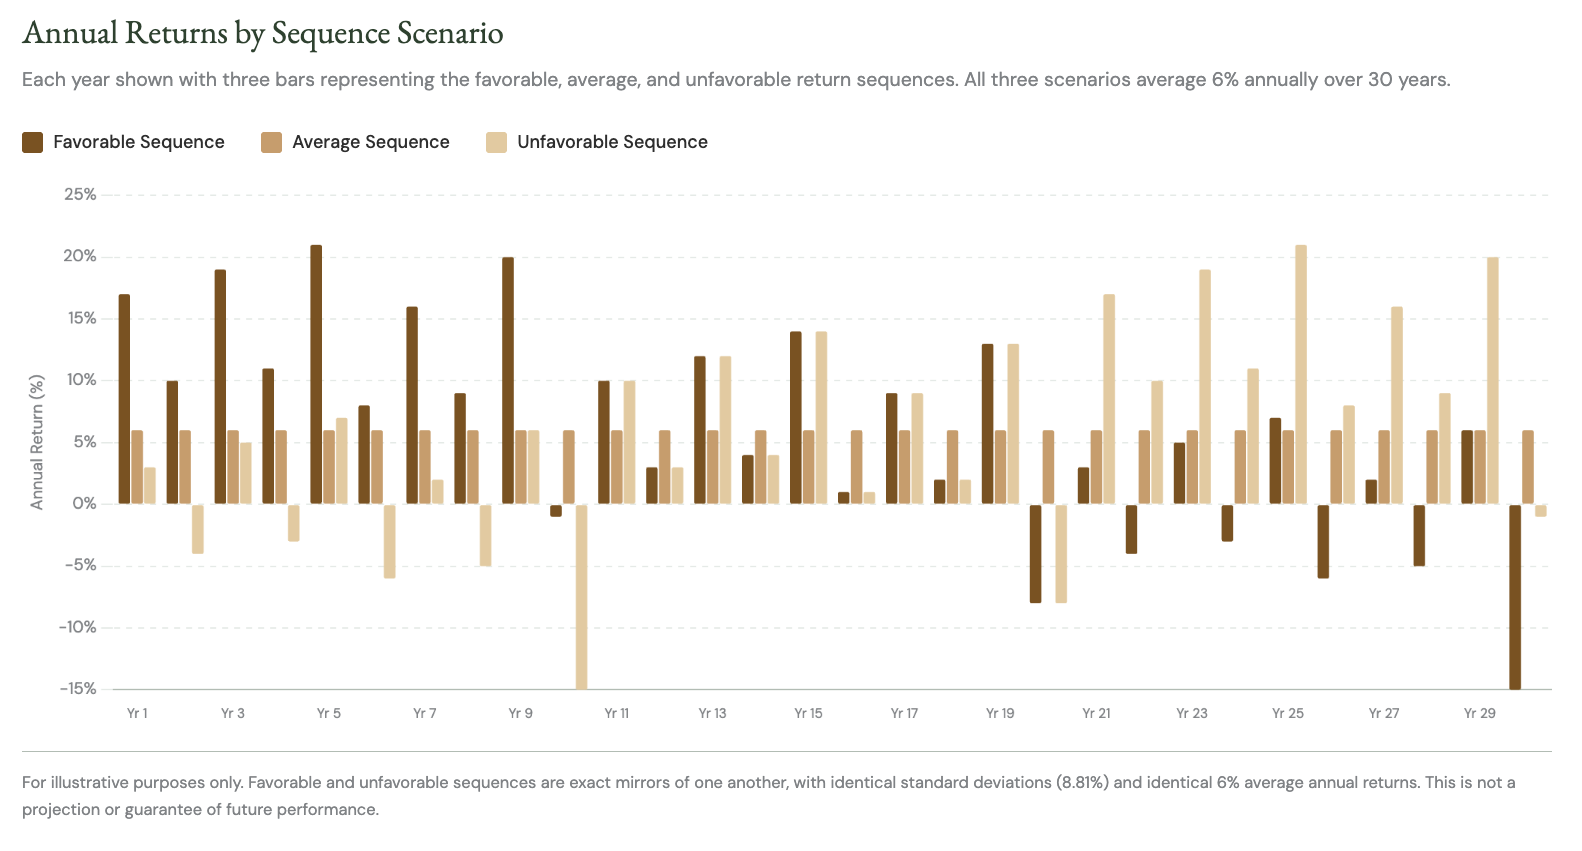
The line chart below shows what those return sequences do to portfolio value over time. The bar chart that follows shows the actual return each year for each scenario. The favorable and unfavorable sequences are exact mirrors of one another, with identical average returns and identical standard deviations.
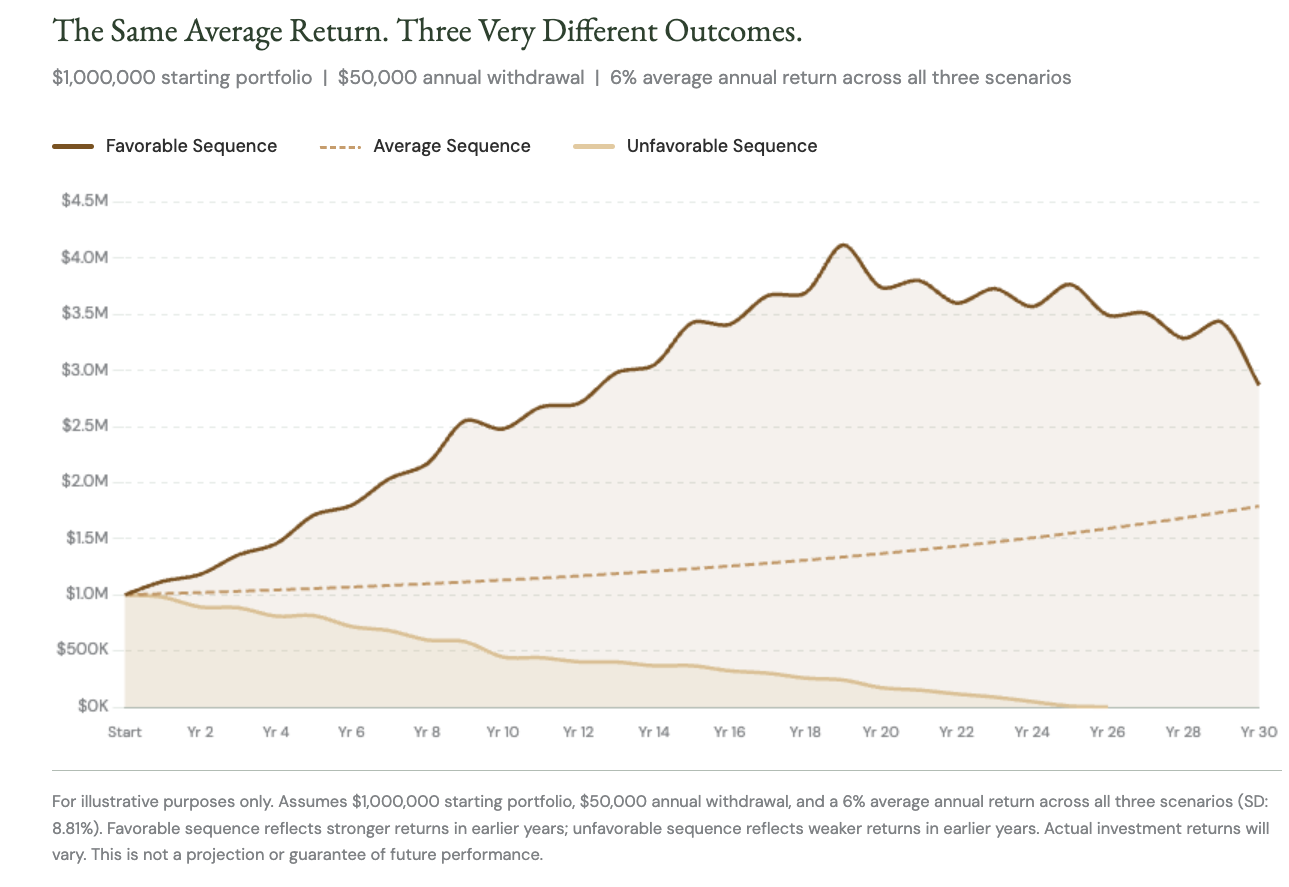
The retiree who experienced stronger returns early ends Year 30 with approximately $2.9 million. The retiree with steady, average returns ends with roughly $1.8 million. The retiree who encountered weaker markets in the first decade runs out of money entirely by Year 26, despite earning the same average return over the same period.
$2.9M — Favorable sequence, ending value at Year 30
$1.8M — Average sequence, ending value at Year 30
$0 — Unfavorable sequence, money runs out in Year 26
Both variable portfolios had a 6% average annual return and an identical standard deviation of 8.81%. By every conventional risk metric, they were the same portfolio. The difference in outcome is entirely a function of when the weak years occurred.
What Happens When You Need More Income
The margin for error narrows quickly as withdrawals increase. The chart below shows how the unfavorable sequence plays out at three different annual withdrawal levels. All three lines use the unfavorable return sequence; the only variable is how much is withdrawn each year.
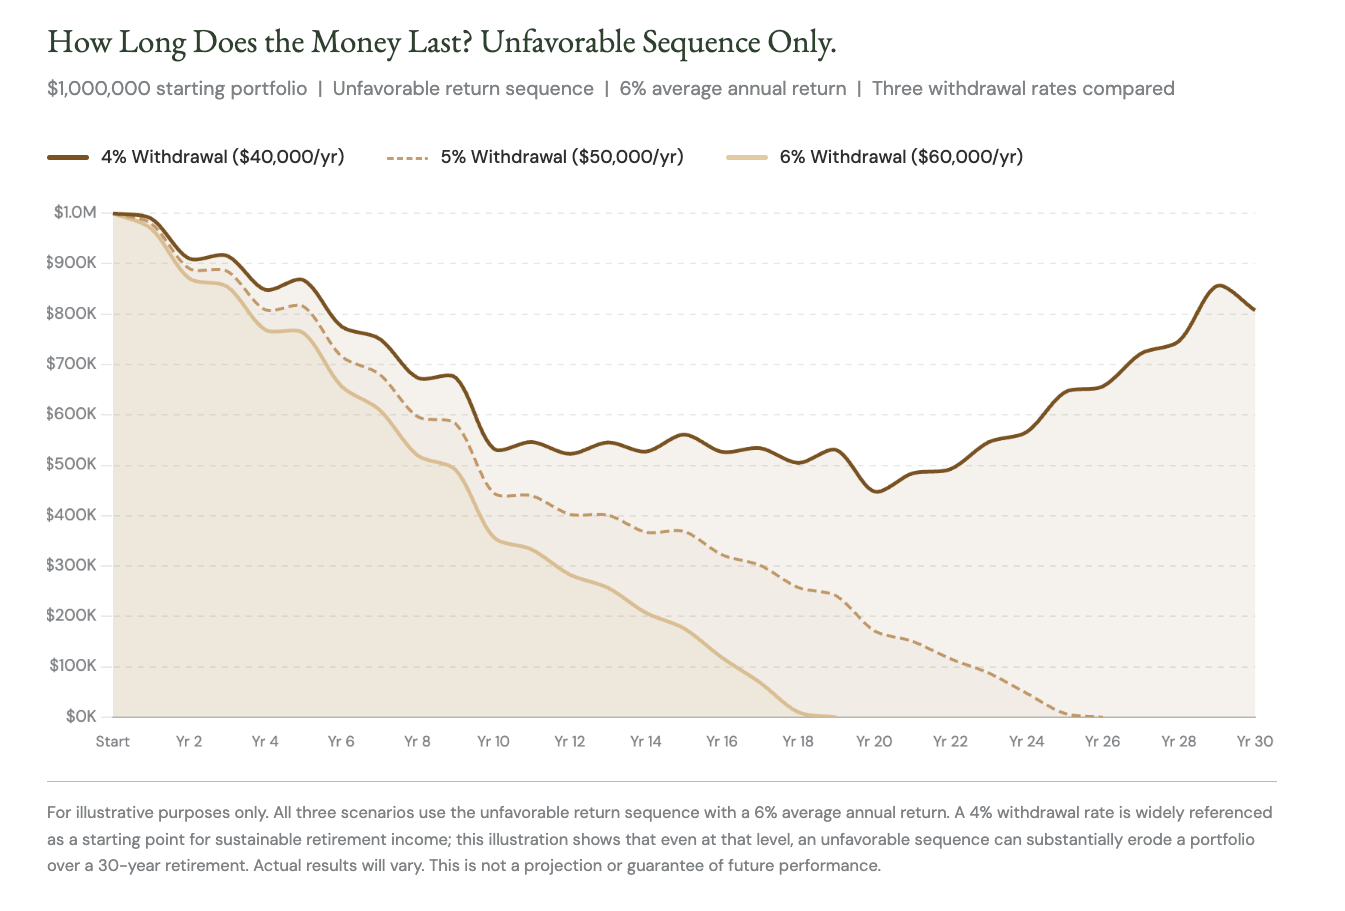
At a 4% withdrawal rate, the portfolio survives 30 years but ends with $807,000, a fraction of what a favorable sequence would have produced. At 5%, it depletes entirely by Year 26. At 6%, it is gone by Year 19, more than a decade before most retirements end.
Withdrawal rates cannot be evaluated in isolation. The sequence you experience in the early years of retirement matters as much as the rate itself.
What You Cannot Control, and What You Can
No one knows what the market will do in the first five years of retirement. A retiree who left work in 2000 faced the dot-com collapse immediately. One who retired in 2010 enjoyed a decade-long bull market. Neither made a wrong decision. Timing is outside anyone's control.
What is not outside your control is how the portfolio is structured and managed when distributions begin. That is where planning matters most.
Strategies That Help Mitigate the Risk
While sequence of returns risk cannot be eliminated, it can be managed. Several strategies, applied thoughtfully and in combination, can meaningfully reduce its impact.
Risk Management and Portfolio Construction
The most direct lever is reducing the portfolio's exposure to drawdown risk at the moment distributions begin. A portfolio that loses 30% in year one of retirement requires a 43% gain just to break even, before accounting for withdrawals. Reducing the severity of early losses through appropriate asset allocation, diversification, and risk management strategies limits the damage that sequence can do. This does not mean abandoning growth. It means calibrating the portfolio to survive early turbulence without permanent impairment.
Selective Distribution Planning
Not all assets are created equal when it comes to withdrawal sequencing. A well-structured distribution strategy draws from different account types and asset classes in a deliberate order, preserving growth-oriented assets during down markets and pulling from more stable holdings when equities are stressed. This may involve maintaining a cash reserve or short-duration income tier specifically designated for living expenses in the early years of retirement, reducing the need to liquidate equities at depressed prices.
Minimizing the Fixed Income Gap
The period between retirement and the activation of guaranteed income sources (Social Security, pensions, or annuity payments) is often the most vulnerable window. During this gap, the portfolio bears the full weight of income needs without a floor. Reducing that gap is partly a financial planning exercise and partly a matter of direct personal choices. Delaying full retirement by a year or two, taking on part-time or consulting work in the early retirement years, or trimming fixed expenses before leaving the workforce can each meaningfully shorten the window of full portfolio dependency. These are not compromises; they are choices that keep more options open later. On the planning side, strategies that accelerate the activation of guaranteed income, or that bridge the gap with purpose-built income vehicles, work best when the portfolio isn't carrying the full load from day one.
Dynamic Withdrawal Strategies
A fixed dollar withdrawal does not adapt to market conditions. A dynamic withdrawal approach, one that allows for modest flexibility in spending during down years, can meaningfully extend portfolio longevity. Even small adjustments, such as temporarily reducing discretionary spending during a poor sequence, can preserve enough capital to recover when conditions improve.
The strategies that matter most are put in place before retirement begins. Once distributions start, the window for structural change narrows, which is why sequence risk is best addressed in the years leading up to it.
Building a Plan That Accounts for Sequence Risk
Sequence of returns risk is not a problem that resolves itself. It requires proactive construction before retirement begins and active management as distributions unfold. These strategies are not exotic or complicated, but they require coordination across the portfolio, income plan, and distribution strategy.
That coordination is what an ongoing planning relationship is built to provide. If you are within ten years of retirement and have not explicitly addressed sequence of returns risk in your financial plan, it is worth a conversation. We help clients develop retirement income strategies designed to account for varying market conditions and evolving income needs.
We work with a limited number of new clients each year to ensure every relationship receives the attention it deserves. If you are ready to explore whether Donohue Wealth Management is the right fit, we would welcome the opportunity to learn more.
Sources
Pfau, Wade D. "The Lifetime Sequence of Returns: A Retirement Planning Conundrum." Retirement Researcher. September 2013. retirementresearcher.com
Bengen, William P. "Determining Withdrawal Rates Using Historical Data." Journal of Financial Planning. October 1994.
Kitces, Michael E. "Understanding Sequence of Return Risk." Kitces.com. kitces.com/blog
Morningstar. "State of Retirement Income: Safe Withdrawal Rates." 2022.
Chart data: hypothetical illustration calculated by Donohue Wealth Management using assumed return sequences. For illustrative purposes only.
Methodology
Common assumptions. All three figures assume a $1,000,000 starting portfolio at the outset of a 30-year retirement and a 6% average annual return. Figures 1 and 2 assume a fixed $50,000 annual withdrawal. Withdrawals and returns are applied annually; no taxes, advisory fees, or transaction costs are reflected, all of which would reduce actual results.
Return sequences. Three return paths are modeled. The "average" sequence applies a steady 6% return every year. The "favorable" and "unfavorable" sequences are exact mirror images of one another (the favorable path front-loads stronger returns and the unfavorable path front-loads weaker returns) and are constructed so that both share an identical 6% arithmetic average annual return and an identical 8.81% standard deviation over the full 30-year period. This isolates the effect of return order from the effect of average return or volatility.
Figure 1: annual returns. Shows the yearly return applied under each of the three sequences. Because the favorable and unfavorable paths are mirrors, every above-average year in one corresponds to a below-average year in the other.
Figure 2: portfolio value. Applies each return sequence to the starting balance, net of the annual $50,000 withdrawal, tracking the resulting account value across all 30 years. Ending values are approximate: roughly $2.9 million (favorable), roughly $1.8 million (average), and full depletion by Year 26 (unfavorable).
Figure 3: withdrawal sensitivity. Holds the unfavorable return sequence constant and varies only the annual withdrawal. At 4% ($40,000), the portfolio survives the full 30 years and ends near $807,000; at 5% ($50,000), it depletes by Year 26; at 6% ($60,000), it depletes by Year 19.
Limitations. These are hypothetical illustrations, not projections. The fixed 6% average and constant withdrawals simplify a far more variable reality; actual returns, inflation, taxes, spending, and longevity will differ and may be materially better or worse. The directional conclusion, that the order of returns can meaningfully affect how long a portfolio lasts, holds across a wide range of assumptions.
Disclosures
General. This material has been prepared for informational purposes only and does not constitute investment, tax, or legal advice. Past performance is not indicative of future results. The information contained herein is believed to be from reliable sources, but its accuracy and completeness cannot be guaranteed. All investing involves risk, including the potential loss of principal.
Illustrations. All charts are for illustrative purposes only and reflect hypothetical scenarios based on assumed return sequences. These examples do not represent actual client results or guarantee future performance. Assumptions used may not reflect actual market conditions, and actual results may vary materially.
Firm. Donohue Wealth Management is supported by McAdam LLC. McAdam LLC dba Donohue Wealth Management is an SEC registered investment adviser. Registration does not imply a certain level of skill or training.